Space Weather Lab
Education-first dashboards for amateur radio operators (UTC)
Solar Cycle 25 (predicted range)
These are NOAA/SWPC published predicted ranges. For operating, treat this as a baseline trend indicator (months/years), not a day-to-day forecast. Day-to-day outcomes are dominated by solar eruptions (flares/CMEs) and geomagnetic activity.
More context: SWPC Solar Cycle Progression
Key Indices (Current conditions)
| Metric | Now | Notes |
|---|---|---|
| Planetary Kp (1m) | 5 | as of 2026-03-21T05:18:00 |
| A-index (daily) | 132 | date 2026-03-21 00:00:00.000 |
| F10.7 / SFI | 102 | as of 2026-03-20T22:00:00 |
| NOAA Scales | R0 / S0 / G2 | Radio blackouts / Radiation / Geomagnetic |
| Max Kp expected (3d) | 6.67 | Forecast headline |
| Active regions | 2 | More regions can mean higher flare odds |
What does this mean to me?
These numbers are the day-to-day knobs. The charts on this page are trend-level (months/years).
Use both: cycle baseline tells you what’s possible; Kp/A/RSG tell you what’s likely right now.
How to read these charts
- The shaded band is the predicted range (uncertainty), not a single forecast line.
- The values are smoothed (trend-level), so they won’t show day-to-day flare/storm behavior.
- X-axis is year; Y-axis is the smoothed value (SSN or F10.7).
Practical ham-radio implications
- Higher cycle baseline: higher probability of frequent 15m/12m/10m openings (when geomagnetics are quiet).
- Lower cycle baseline: 40m/80m stay “reliable” more often, but high-band DX becomes more episodic.
- Geomagnetic storms can overwhelm a strong cycle temporarily; always check Kp and current conditions.
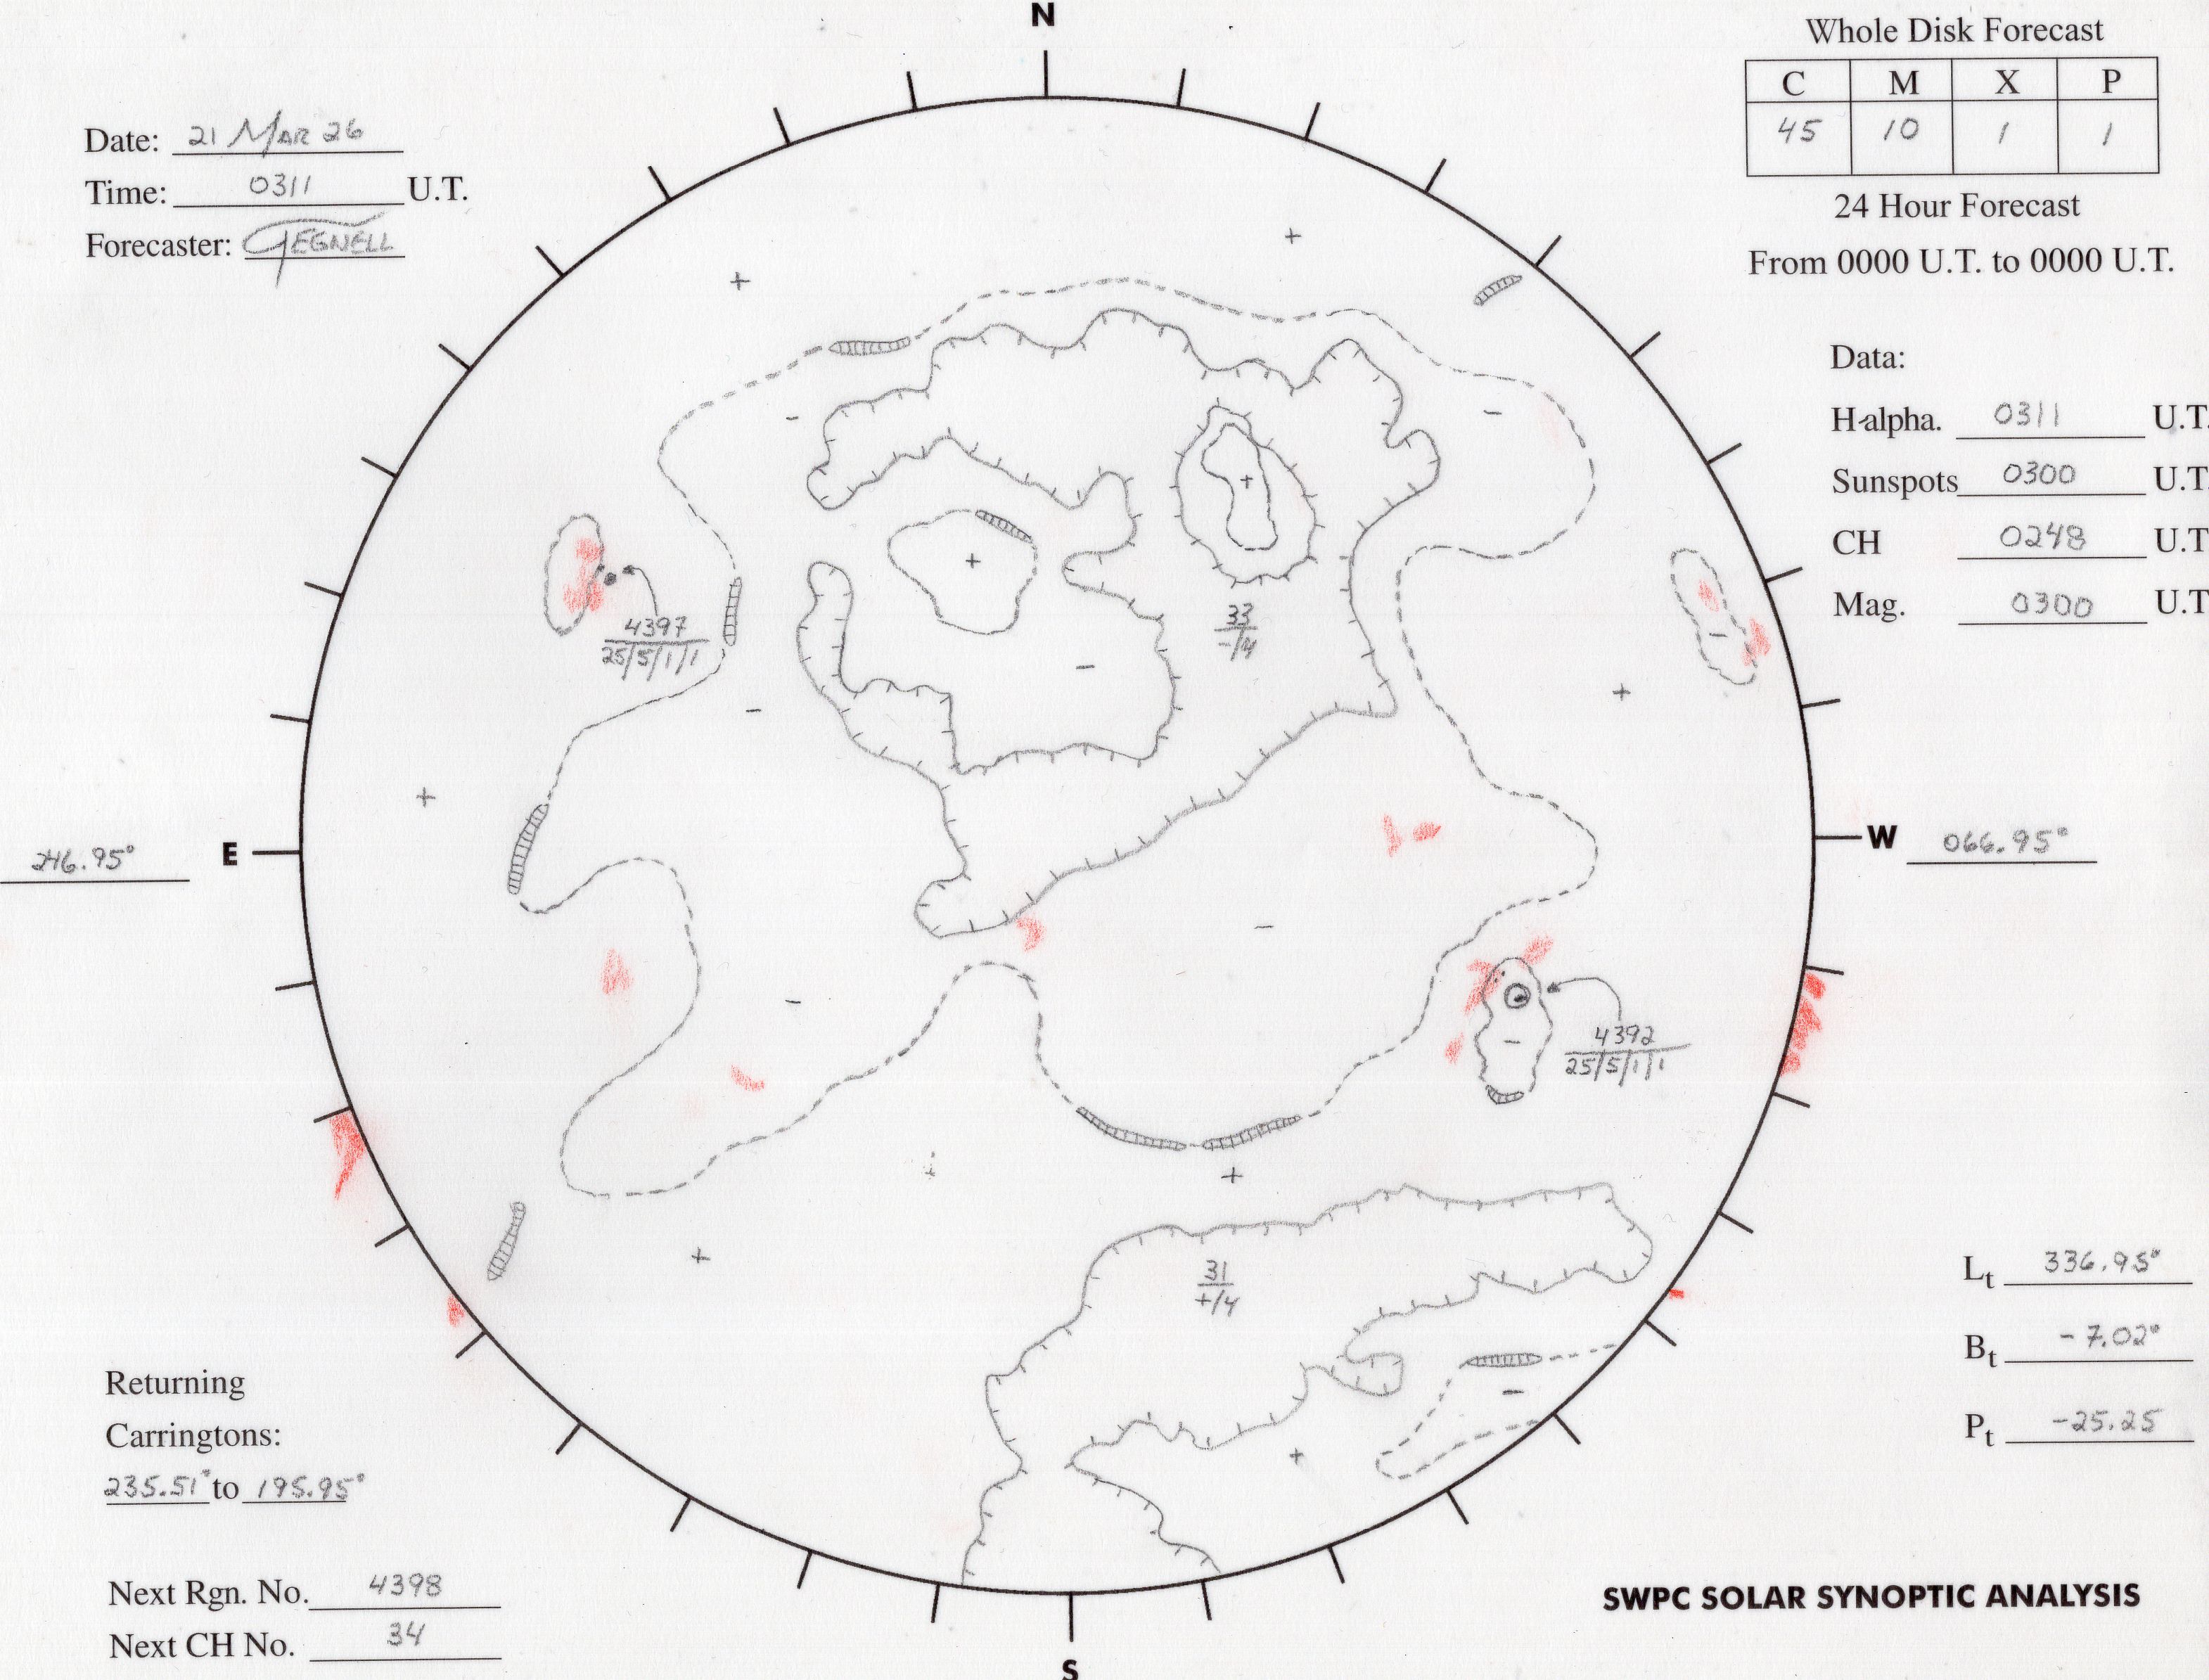
Current Solar Synoptic Map
A context image showing solar active regions over a full rotation. It’s not a cycle forecast, but it helps connect “what the Sun looks like” to activity discussions.
Smoothed Sunspot Number (SSN)
What does this mean to me?
A higher solar-cycle baseline generally increases the chance of strong high-band HF (15m/10m) openings. It does not prevent storms or flares.
Smoothed F10.7 (10.7 cm solar flux)
What does this mean to me?
Higher smoothed F10.7 typically supports higher MUF, so the “ceiling” for HF propagation trends upward during stronger parts of the cycle.