Propagation — how your signal actually gets there
Propagation is the combination of physics (electromagnetics), the atmosphere (ionosphere + troposphere), and geometry. This page focuses on a practical operator model: what mode is likely, what changes it, and what it means for your station.
Today’s quick context (the two knobs you’ll check most)
What does this mean to me?
What does this mean to me?
What does this mean to me?
At-a-glance (operator snapshot)
A quick table view (in the spirit of the classic dashboards): grab the essentials, then dive deeper if needed.
| Metric | Now | Why it matters |
|---|---|---|
| SFI / F10.7 | 102 | Baseline ionization → MUF (high bands). |
| Kp | 5 | Storminess → instability (polar paths degrade first). |
| A-index (daily) | 132 | Smoothed geomagnetic activity (day-scale). |
| Max Kp expected (3‑day) | 6.67 | Quick heads-up for storm potential. |
| Active regions (SWPC) | 2 | More regions can mean higher flare odds (not a guarantee). |
| NOAA scales (current) | ||
|---|---|---|
| R (radio blackout) | 0 | none |
| S (solar radiation storm) | 0 | none |
| G (geomagnetic storm) | 2 | moderate |
| HF band conditions (heuristic) | ||
|---|---|---|
| 10–12–15 m | poor | Low solar flux and/or elevated geomagnetic activity. |
| 17–20 m | fair | Stormy conditions can degrade polar/high-latitude paths. |
| 30–40 m | fair | Often workable; watch storm effects on longer/high-latitude paths. |
| 60–80 m | fair | Expect flutter/absorption on some paths; try non-polar routes. |
SFI, A-index, and K-index scales (quick reference)
These are the three main “quick-look” numbers most hams watch: Solar Flux Index (SFI/F10.7), the K-index/Kp, and the A-index. The exact impact depends on band, path, and latitude — but these tables are a useful first pass.
| SFI (Solar Flux Index) / F10.7 | |
|---|---|
| 70 | Not good |
| 80 | Good |
| 90 | Better |
| 100+ | Best |
| Now | 102 (Best) |
| A-index (daily average magnetic activity) | |
|---|---|
| 0–7 | Quiet |
| 8–15 | Unsettled |
| 16–29 | Active |
| 30–49 | Minor storm |
| 50–99 | Major storm |
| 100–400 | Severe storm |
| Today | 132 (Severe storm) |
| K-index (updated every 3 hours) | |
|---|---|
| 0 | Inactive |
| 1 | Very quiet |
| 2 | Quiet |
| 3 | Unsettled |
| 4 | Active |
| 5 | Minor storm |
| 6 | Major storm |
| 7 | Severe storm |
| 8 | Very severe storm |
| 9 | Extremely severe storm |
| Now | 5 (≈K 5 Minor storm) |
Ionospheric layers (day vs night)
Original diagram: the same core idea as the common “layers” slide, but drawn in-house. The big take-away is simple: D absorbs, F2 refracts, and day/night changes everything.

Layer-by-layer: what it affects (and what harms it)
You’ll often hear “the ionosphere reflects radio.” More precisely: it refracts HF when the electron density profile supports it. Each region behaves differently, and different space-weather events push different failure modes.
| Region | Altitude (typ.) | Helps / Enables | Hurts / Symptoms | What drives it |
|---|---|---|---|---|
| D | ~60–90 km | Almost never “helps” HF; it mainly sets the LUF. | Daytime absorption; low bands (160/80/40) get weaker and noisier. During strong flares, HF can fade out on the sunlit side. | Sunlight (UV/X‑ray). Stronger in daylight; largely collapses after local sunset. |
| E | ~90–150 km | Shorter hops (regional/medium range). Can support near-vertical paths (NVIS-like geometry) when D isn’t too lossy. | Often “masked” by D absorption in daytime on lower HF. Weakens at night but can linger into early night. | Solar illumination + seasonal chemistry; tends to be most usable around dawn/dusk transitions. |
| Es | ~95–120 km | Surprise VHF openings: 10m/6m and sometimes higher. Can create very strong, sharp skip. | Unpredictable; openings can appear/disappear quickly; not tightly correlated to SFI/Kp. | Complex: wind shear + metallic ions; strongest seasonal patterns (late spring/summer mid-latitudes). |
| F1 | ~150–250 km (day) | Supports HF during daytime; usually a “bridge” layer. At night, merges with F2 into one F region. | Less “headline” impact than F2, but when overall ionization is low you may notice weaker higher-band support. | Daylight ionization; stronger in summer daytime. |
| F2 | ~250–400+ km | The main HF DX engine (especially 20/15/10 when MUF is high). Enables multi-hop long-haul paths. | During geomagnetic storms: fades/flutter, lower MUF, polar-path loss, unstable openings. During deep solar minimum: higher bands can go quiet for days. | EUV baseline (solar cycle / SFI) + geomagnetic activity (Kp/A). Also season + latitude effects. |
What conditions affect the layers?
- Solar illumination (day/night): D-region absorption is strongest by day; low bands improve after sunset.
- Solar cycle baseline: higher EUV generally increases F-region density (higher MUF).
- Geomagnetic storms: can deplete/redistribute ionization, increase absorption, and make propagation unstable (especially high latitude).
- Season and latitude: change the ionosphere’s chemistry and sunlight geometry; affects typical MUF/LUF patterns.
- Atmospheric waves: tides and gravity waves modulate density; can help explain rapid swings in conditions.
What does this mean to me?
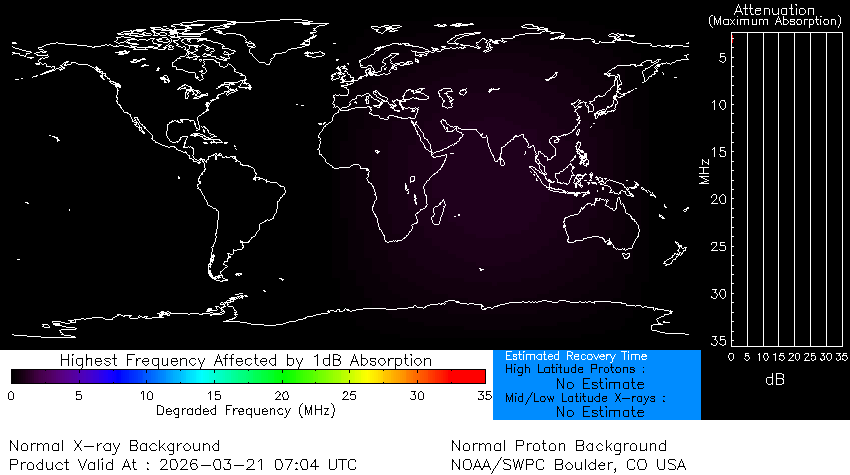
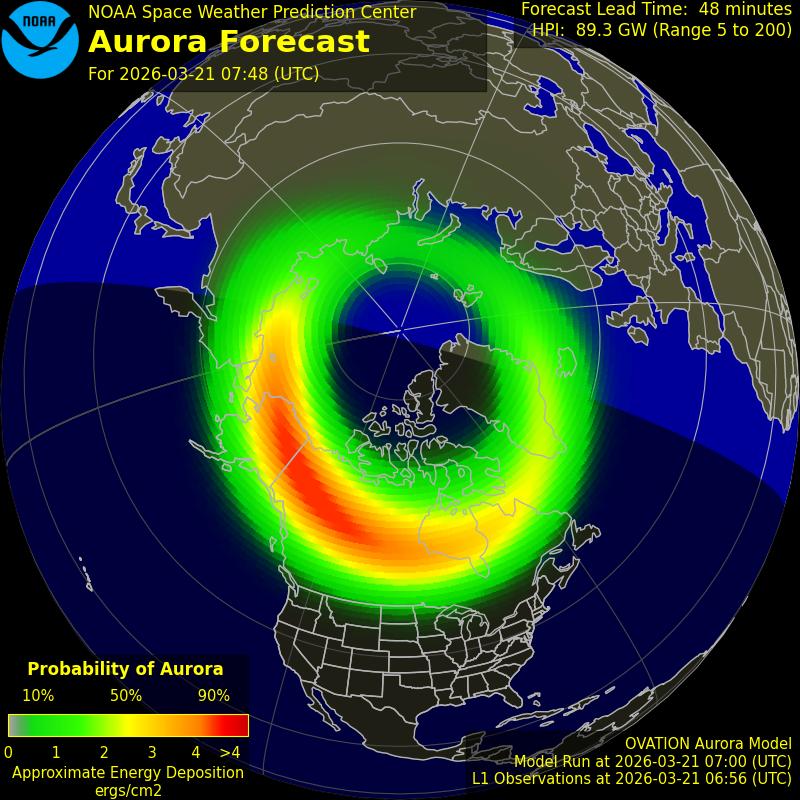
Live absorption + aurora context (SWPC products)
Practical operating playbook (what this means to me)
This is a deliberately simplified “first-order” cheat sheet. Real-world propagation depends on path geometry, season, latitude, and current conditions — but this table helps you pick a band and a plan fast.
| Band | Most Likely Modes | Typical “Engine” | Best Time | Operator Notes |
|---|---|---|---|---|
| 80m | NVIS, regional, occasional DX | F region at high angles; D absorption sets the floor | Night | Best for local/regional nets; quieter after sunset; watch local noise. |
| 40m | Regional + DX | F region | Late afternoon → night | Workhorse band when higher bands are weak; can support long-haul at night. |
| 20m | DX, contesting, reliable day paths | F2 region (main HF refraction) | Day → early evening | First place to check for HF DX. When conditions are “meh,” 20m often still works. |
| 15m | DX, strong daytime openings | F2 region (needs higher MUF) | Midday | Likes higher F10.7 and quiet geomagnetics; great when it’s open. |
| 10m | DX, short skip, sometimes “wide open” | F2 region (high MUF) + sometimes Es | Midday (F2) / seasonal (Es) | When it opens it’s spectacular; when it’s closed it’s silent. Check beacons and FT8 activity. |
| 6m | Sporadic E, meteor scatter, tropo, (rare) F2 | E region (Es) + troposphere | Late spring/summer (Es) | Space weather is secondary most days; learn Es seasonality and watch cluster/beacons. |
| 2m/70cm | Line-of-sight, tropo, aurora, satellites | Troposphere / magnetosphere interactions | Weather-driven / storms | Tropo follows weather patterns; aurora needs geomagnetic disturbance and has a distinctive “buzz.” |
Use VOACAP to predict a specific path
Indices tell you “background conditions.” VOACAP helps answer the operator question: What band and what time is most likely to work between two places?
- Set TX and RX locations (grid/city) and the month (season matters).
- Choose mode assumptions (CW/SSB/digital) and power level.
- Start with “typical” antennas if you’re unsure; refine later.
- Look for the hours/bands with the highest reliability and usable SNR.
- If your path crosses polar regions, treat higher Kp/A days as a warning sign.
- 80m/40m: strongest at night; great for regional + DX when noise permits.
- 20m: the most reliable DX workhorse; first place to check.
- 15m/10m: best when F10.7 is higher and geomagnetics are quiet; check around local noon.
- When Kp is high: avoid polar routes first; try non-polar headings and lower bands at night.
- 2m/70cm: mostly line-of-sight; look for tropo enhancements (weather-driven).
- 6m: seasonal Sporadic E can create huge openings; space weather is secondary.
- Aurora: during storms, you may get auroral scatter (distinctive distorted audio/tones).
- Satellites: watch for scintillation/fades during disturbed conditions.
FCC + authoritative references (high-level)
I’m not reproducing FCC text verbatim here (copyright/licensing varies by source formatting), but you should treat the FCC rules and official handbooks as the canonical source for definitions and compliance.
- FCC ECFR (47 CFR Part 97): ecfr.gov/.../part-97
- NOAA SWPC (space weather products): swpc.noaa.gov/products-and-data
- ITU-R P.533 (HF prediction reference, technical): itu.int/rec/R-REC-P.533
- HamQSL Solar Data page (handy dashboard): hamqsl.com/solar.html
If you want, I can add a dedicated “Propagation Sources” section mirroring Sources page style.